
Getting Started 1. Chart Handling
![]()
qtVlm is quite a complex program, with many features. We will be writing a series of articles to get you started, this is the first...
Assuming you have got the charts and qtVlm installed (easy default auto install from Unified Charts), this article shows you how to start looking around them. You will see that the "M" button can turn on or off the tiled charts, it can also "Lock Level" which is something you will need.
In general, the chartsets are fairly seamless, all you need to do is drag around and zoom in or out for the charts to adjust themselves.
TIP 1: When dragging and zooming in or out, ALLOW TIME for the charts to "settle". They may look extremely pixellated as they settle down or change levels.
In some areas of coverage, esp. where a large scale insert is laid over a smaller scale underlying chart you may get "Holes" in the charts. The example below show Queenborough in the Swale, where the insert causes a gap to appear at the edges of the chartlet.
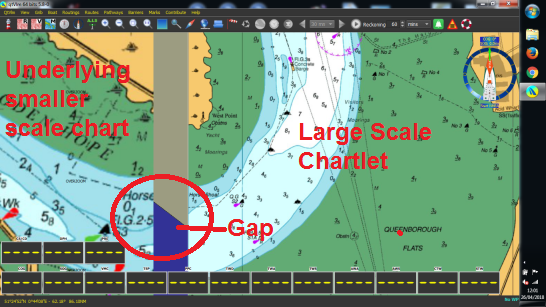
You will find examples like this as you drill in and out of the charts
To solve this you can zoom out a bit until the smaller scale underlying and seamless charts drop in. But to AVOID keep having your view disrupted as you zoom in and out in this area, you can LOCK LEVEL.
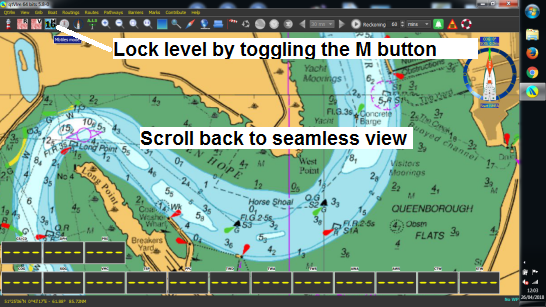
Scroll back to seamless view, then LOCK LEVEL by toggling the "M" button.
What you've done here is basically locked onto a zoom level to suit your purpose. You can see the "M" button shows what level..it's 16. Now as you zoom in or out the zoom level is fixed, and you will be making use of this feature for sure. Toggling the "M" button will switch back to auomatic chart switching. The number will disappear.
This effect is the equivalent of:
1. Toggling between "A" and "M" on the Marine Navigator app (automatic or manual chart switching)
2. Pressing F10 in SeaClear to move back one scale of chart
3. Choosing or blocking charts in OpenCPN quilt by using the blue blob buttons at the bottom of the screen.
Reason you will want to use this:
1. When planning a longer trip, to get the overview
2. When inconvenient "Holes" disrupt your seamless chart viewing
3. When displaying gribs(wind/wave/tide) over the charts.. you need the overview
4. When in qtVlm simulation mode, say a Channel Crossing, with gribs & polars loaded. And qtVlm doing the routeing. Again the overview situation.
Best way to learn is to play with it yourself. Unified Chart buyers will have this for free, bundled with their Windows packages, other platforms (Mac Linux, RasPI, even iOS) can buy "Cross Platform qtVlm Charts" that we also make.
More hints, tips etc. to come
Article Info
Related articles