
Install Cross Platform qtVlm Charts
![]()
The installation process is basically the same across all platforms...
Step 1 Get and install qtVlm (version 5.8 onwards) onto the target machine. Free for "Desktop" machines
Step 2 Phones and tablets with the qtVlm app: You pay for the chartset you want and then download it DIRECTLY to your iphone. Once downloaded you open it with qtVlm. (OR "send to" qtVlm) On Android locate the VMH download in your downloads folder and tap it. Open with qtVlm (do not unpack it). The app will asorb the charts (Takes a while, just check back in a few mins). It then asks you for an unlock code. You type in the unlock code and the charts will unlock.
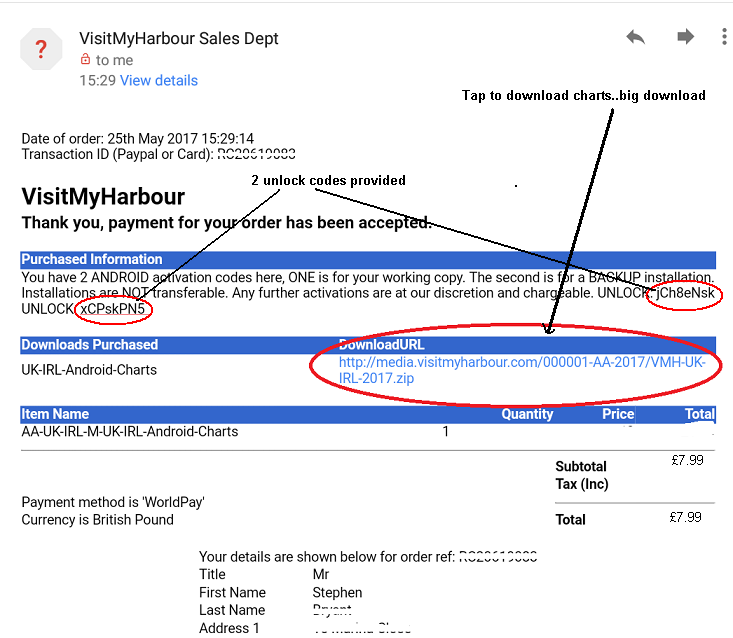
OR Step 2 Desktops Pay for and download the VMH chartset required onto a "Desktop" machine. It will arrive in a .zip folder. Extract contents. There will be 2 files, a .vmh file and a .hdx file. Save the original shopping cart email CAREFULLY. It has the 2 Unlock codes. It looks similar to this
Step 3 Find the qtVlm program installation folder and put the * .vmh file and the matching * .hdx file in the MBtiles folder.( On Windows Program Files >>> qtvlm>>> mbtiles). The crux of the matter is to get the VMH charts.. the 2 items..into the mbtiles folder of the qtVlm program. NOTE: You can make copies of the charts and save carefully elsewhere. NOTE 2: You can put the VMH charts in a seprarate folder elsewhere and point qtVlm at this folder .. as shown below.
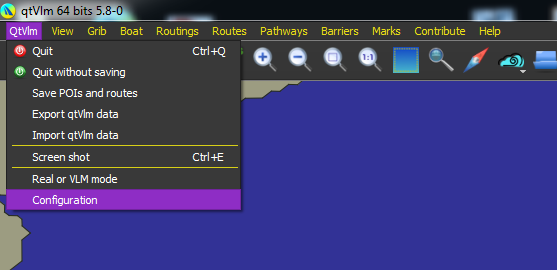
Step 4 Activate the charts. You need to be online for this bit. Start qtVlm, click the qtVlm header and choose Configuration
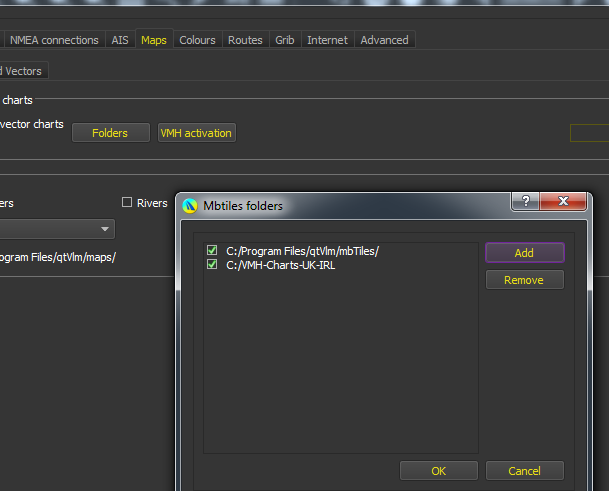
In the window that opens, choose the Maps tab, then Folders:
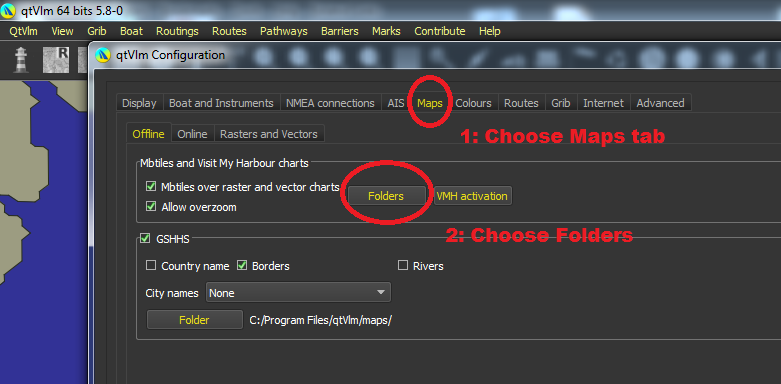
Next
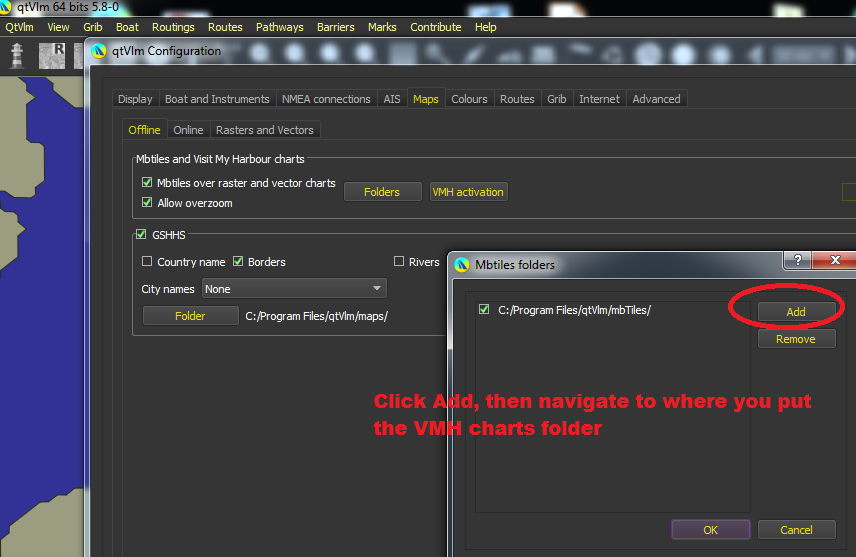
In this case we put the VMH charts folder straight on Disc C and pointed qtVlm at it, then clicked OK:
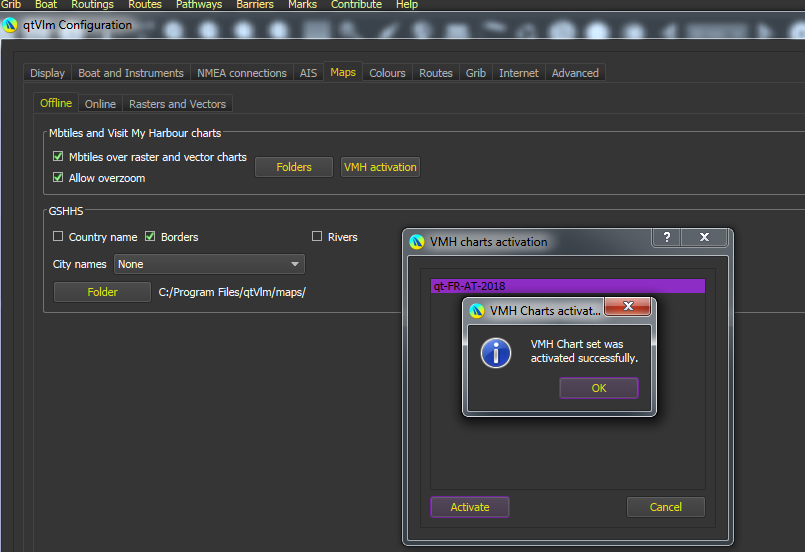
Now Click VMH activation, highlight the chartset you're activating, click Activate, then type in your 8 digit unlock code and click OK:
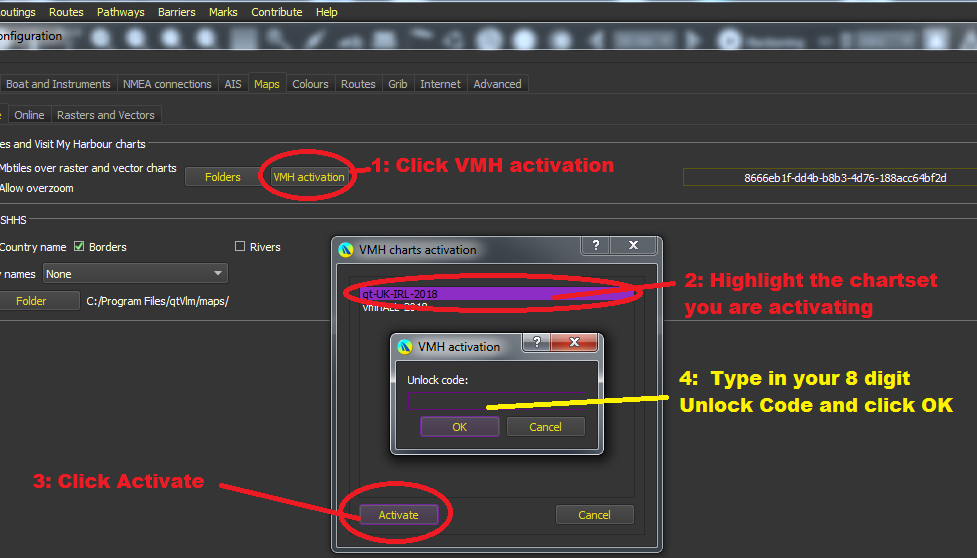
Activation acheived and confirmed. Note the 8 digit code you have just used can be used again but ONLY on this machine (in case you accidentally delete the program and have to start again). Make a note of which machine(s) you used each code on.
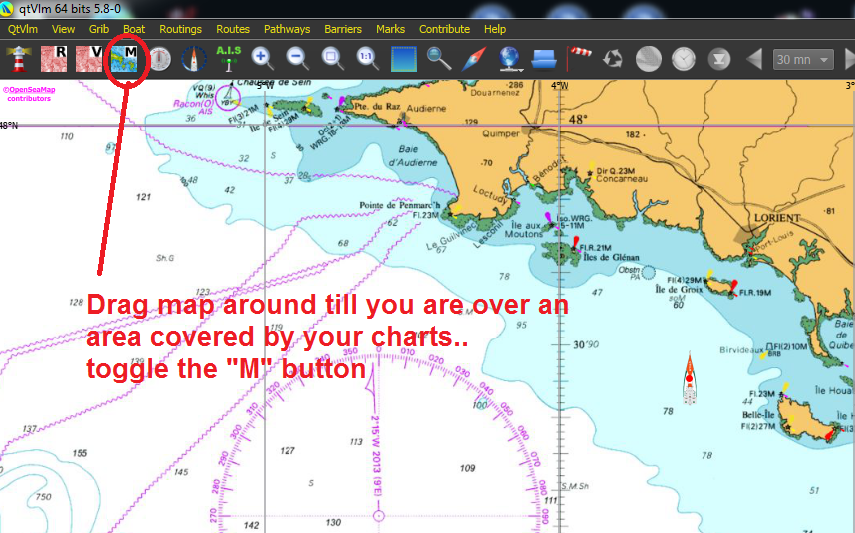
Get the underling map over an area you have got covered with your charts, the toggle the "M" button
At this stage your charts are locked to the target machine/device and are useable whenever you run qtVlm in future. Updating the program in future should not lose your activation/charts.
Hints and tips
No 1. As you zoom in and out the images can look "grainy". They settle after a couple of seconds.
No 2: Holes in the charts ! These are where you are seeing the underlying mapping coming through in areas where there is no chart (often over land areas, sometimes between adjoining chart tiles) If an area you want has a "hole" in it !!!, Zoom back a bit till the underlying charts "cover" the hole, then LOCK LEVEL by clicking the "M" button. Now that image mix will remain as it is and you can zoom in a bit more without it changing charts. Basically you will be LOCKING the zoom at a single level and preventing automatic chart switching. To go back to auto switching, toggle the M" button again.
LINUX: With VMH charts AND Antares charts...
"Just installed qtVlm on a Linux (Debian) laptop and I'm impressed with how easy it is to setup!
First I installed it with the VMH charts (MBtiles) per your instructions, and activated them.
Then, under qtVlm/Configuration/Charts, in the Rasters and Vectors tab, I selected Folders and added the folder with the unzipped Andares charts (BSB and KAP files).
The Antares charts didn't appear.
Back in the Gsshh and Mbtiles tab, there is a setting "Mbtiles over raster and vector charts".
Turn this OFF and the Antares charts appear. (Don't forget to scroll down and hit OK!)
Now you can turn Antares charts ON or OFF with the "R" button (top left).
==================-
I also plugged in a USB GPS dongle, and, using a serial port terminal, (and dmesg, for Linux buffs), found it transmitting on serial port ttyACM0. (Names may be different, like COM1 on Windows)
Under qtVlm/Configuration/NMEA connections, I selected "Serial port 1" and chose ttyACM0, and turned on "Automatically start NMEA at startup" (at the top, and OK at the bottom).
Then I had to restart qtVlm, and the boat icon was at my real location.
Smooth!
Article Info
Related articles